
Project Analytics Dashboard
What It Does
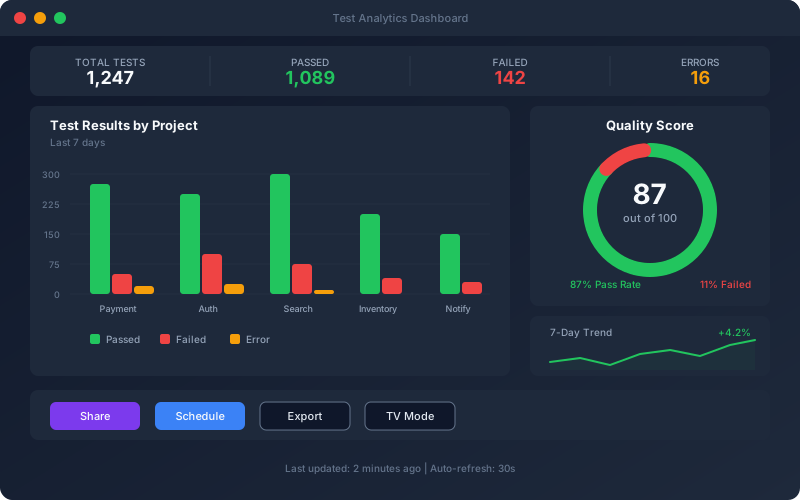
The Analytics Dashboard gives you a view of your API test health for each project. See pass rates, response-time trends, coverage metrics and failure breakdowns, with the top failing tests and their common errors, and compare environments side by side. Coverage is measured against what your specification declares: status codes, parameters and request-body fields. Sharing, embedding, scheduled reports and true-percentile widgets live on Persona Dashboards (Enterprise and Trial).
Overview
A dashboard per project with test status, response-time analysis, coverage tracking, error breakdowns and an environment comparison, for any 7-, 30- or 90-day or one-year window.
Key Capabilities
How It Works
- 1
Navigate to the Analytics section from any project
- 2
View pass rate, coverage and response times
- 3
Filter by project and date range
- 4
Open the top failing tests and per-endpoint results
Available on
professional Plan & Above
Upgrade to the professional plan to unlock this feature.
Documentation
Step-by-step guides for setting up and using Dashboard.
- Analytics Dashboards: Panels and ViewsWork the Analytics dashboard: project overview, execution and performance summaries, endpoint analytics, environment comparison, and trends.
- Understanding Analytics in Shift-Left APIHow Analytics differs from Reporting: trends over time rather than one run. Covers project metrics, time ranges, and what each view answers.
- Dashboard Layout, TV Mode and Focus ProjectReorder, resize, hide and configure dashboard widgets, pick a Focus Project and time range, and show a dashboard full-screen in TV Mode.
Go deeper
Guides and playbooks that show this capability in practice.
Try Dashboard Today
Start your 15-day free trial — no credit card required.