
New · Performance testing
API load testing, built from the tests you already have
Turn your functional REST, SOAP, GraphQL and JSON-RPC tests into load, stress, spike and soak tests. Get a verdict in words, true percentiles, and every cause of failure with the load when it began.
A paid add-on to Professional, Custom and Enterprise licences, in Starter, Team, Scale or Custom packages. Included in the 15-day trial (Scale limits). See the packages
Why API load testing usually goes stale
Load testing is rarely skipped because teams don’t care. It’s skipped because it lives in a separate tool that nobody has time to keep in step with the API.
A second tool, a second language
Functional tests live in one place and load scripts in another. Auth, payloads and chained values get rewritten by hand, then drift out of step with every release.
Numbers without a verdict
A wall of charts and averaged percentiles leaves someone to decide whether the run passed. Warm-up noise and an overloaded load generator quietly skew the answer.
Performance outside the requirements
Nobody can say which requirement was verified under load. Performance targets sit in a wiki, not beside the functional verdict auditors ask for.
From functional test to load test in five steps
- 1
Kind & name
Pick the question you want answered. Each kind starts from a sensible profile.
- 2
Workloads & steps
Choose tests or a workflow. Mix traffic (80% browse, 20% checkout) and bind a data set.
- 3
Load profile
Set stages in users or requests per second. The chart updates as you type.
- 4
Targets
p95 under 800 ms, errors under 1%. A missed target can stop the run early.
- 5
Dry run
See every request, check and data-changing step, plus an estimate. Nothing is sent.
What carries over from your functional tests
There is no second script to write or keep in step. A load test is your functional suite, sent by many virtual users at once.
Same requests, same code
Every request is built by the code a functional run uses, so the same authentication profile, headers and body go out under load.
Credentials that reach the load
Tokens from your authentication profiles are applied to load requests and renewed mid-run. If a profile resolves but does not reach a request, the run warns you instead of producing a report full of 401s.
Chained values carry over
A value saved by one step, such as an order id, is used by the next, exactly as in a functional run or workflow.
Data sets per virtual user
Bind a data set so each virtual user sends different values. Split runs give every load generator its own share of the rows.
Start from what you have
Run as load test on a test, Create load scenario from this pack on a pack, or the five-step designer.
A server log for every run
Each run keeps its own server-side log in a Server log tab, kept out of exports, share links, the assistant and MCP.
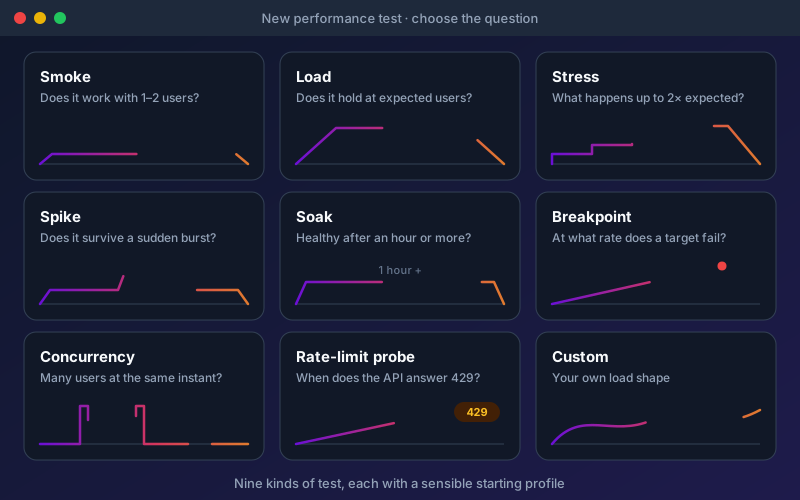
Nine kinds of test, nine different questions
Load, soak and concurrency tests hold a number of virtual users. Stress, spike, breakpoint and rate-limit tests hold a request rate, which keeps sending when the API slows down. With a fixed number of users, a slow API quietly receives fewer requests and the test understates the problem.
| Kind | The question it answers | How the load is applied |
|---|---|---|
| Smoke | Does the scenario run at all, and what does normal look like? | One or two users for a minute |
| Load | Do you meet your targets on a normal busy day? | Your expected users, held for several minutes |
| Stress | Where do the targets break, and how does it fail? | A request rate in steps up to twice what you expect |
| Spike | Does it survive a sudden burst, and how fast does it recover? | Normal traffic, a burst, then normal again |
| Soak | Does it slowly get worse over hours? | Normal users held for an hour or more |
| Breakpoint | What is the most it can handle? | A rising request rate until a target fails |
| Concurrency | Do identical requests at the same instant cause races or duplicates? | Many users sending the same request at once |
| Rate-limit probe | Is the documented rate limit the real one? | A rising rate until the API answers 429 |
| Custom | Your own question | Your own profile |
A report that leads with the truth
The report opens with anything that limits what the run proves, then the verdict in words, for example “All 2 targets met during the hold at 212 requests/s; error rate 0.1%; p95 184 ms.” When a run fails, every cause is listed, grouped by where to look, with how many requests it affected, when it began and the load at that moment, what the server said, and what to do next.
Judged on the steady stage
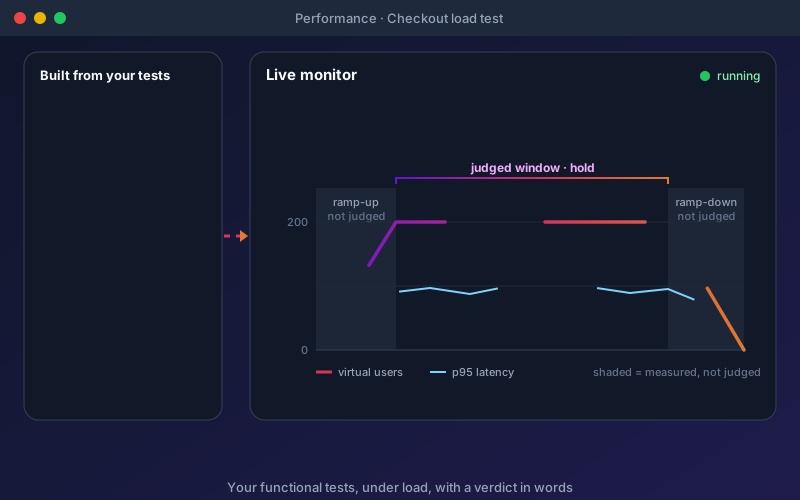
Warm-up and ramp-down are shaded on every chart: measured, not judged.
Percentiles never averaged
Every response time goes into a histogram and histograms are merged, so the run’s p95 is the true p95 of every request.
The load generator is checked too
If the machine sending the load ran out of CPU, the report says so first and the verdict becomes Inconclusive.
Where the time goes
Each step splits into connection wait, DNS, connect, TLS, time to first byte and download, where the platform can measure them.
Errors split by what the server said
A 500 from an exhausted database pool and a 500 from a bad release are different causes, so each error group lists the server’s own messages.
A run log, in order
Queued, precheck, each stage, the first time each failure appeared and the load at that moment, any automatic stop, and the end.
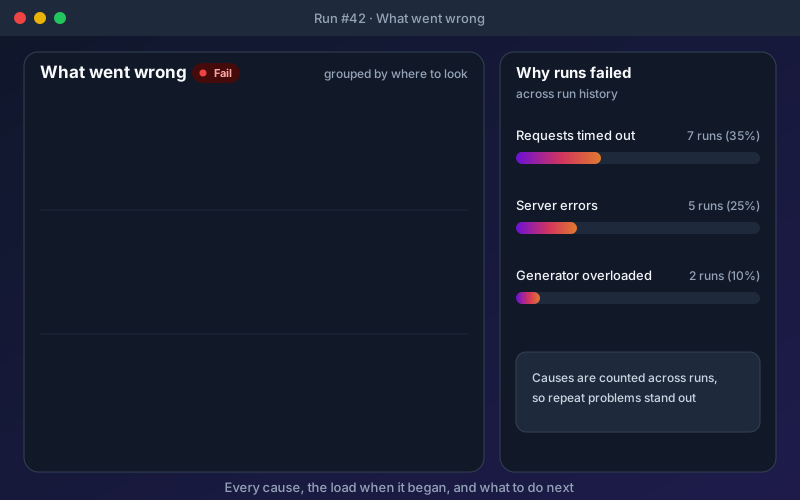
Stress and breakpoint tests mark the knee where response times climb. Spike tests measure recovery, soak tests measure drift per hour, and a rate-limit probe shows the rate at which the first 429 arrived.
Performance targets, in your requirements matrix
Keep performance targets (SLOs) per project, such as “Checkout p95 under 800 ms and errors under 1%, on staging”. They are judged continuously on your ordinary functional runs, so you get a signal without running any load, and again inside every load test that attaches them.
Link a target to a requirement and the traceability matrix shows met or missed in its own Under load column, beside the functional verdict. A requirement can pass functionally and still miss its target under load, and now both are visible to QA leads and auditors.
Performance targets & under-load traceability →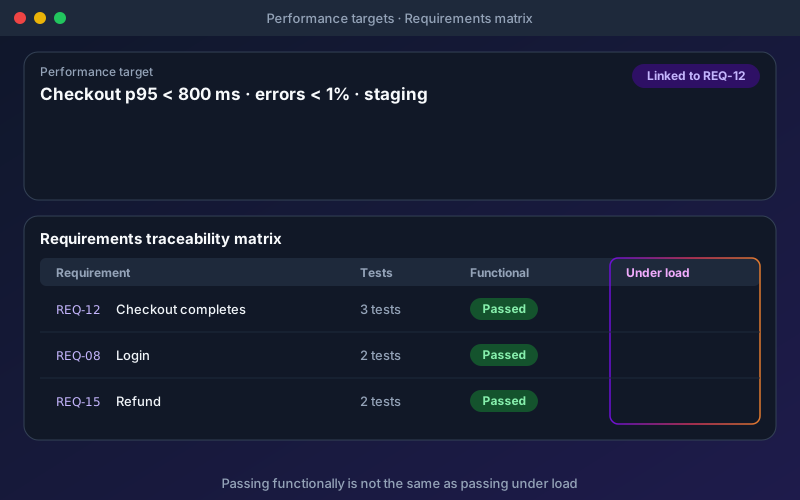
More load, or load from several places
Split a run across load agents: the desktop runner in agent mode, or the Engine. Agents connect out to the server, so no inbound firewall rule is needed. Every generator starts at the same moment, sends its share of the users and data rows, and its measurements are merged exactly. A lost, late or overloaded agent is named in the report.
Distributed load agents →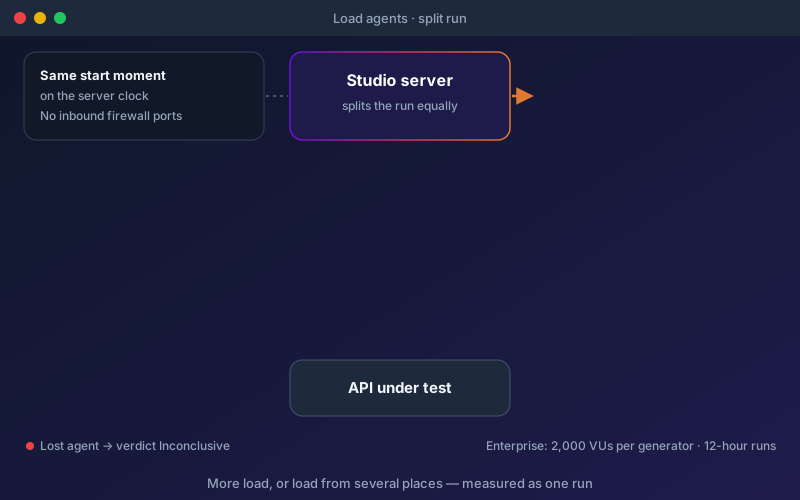
Safety built in
- A dry run builds the exact plan (requests, checks, data-changing steps, an estimate) and sends nothing
- You confirm once per project that you are authorised to send load to its environments
- Production is refused unless an Administrator allows it, and even then the environment’s name must be typed
- One request per step is sent as a precheck, so a broken environment is refused with the reason
- A run stops itself if more than half its requests fail for ten seconds
- AI agents connected through the MCP server can read load runs but cannot start one
Run it from CI/CD
Start a scenario with an API key, wait for it to finish, and hand the JUnit report to your pipeline. Each target becomes a test case, and the report says why a run failed. Exports also include HTML, JSON and CSV, and scenarios can run on a schedule.
POST /api/performance/scenarios/{scenarioId}/run
GET  /api/performance/runs/{runId}
GET  /api/performance/runs/{runId}/junit.xml
Paid add-on
Performance & Load Testing add-on
Performance testing is a paid add-on to a Professional, Custom or Enterprise licence. No edition includes it on its own, Enterprise included. The add-on’s package sets the limits. The 15-day Trial includes it with the Scale limits, so you can evaluate it before you buy.
| Package | Virtual users per load generator | Longest run | Runs at once | Load agents |
|---|---|---|---|---|
| Starter | 100 | 15 minutes | 1 | None |
| Team | 500 | 60 minutes | 1 | 2 |
| Scale | 2,000 | 12 hours | 2 | Any number |
| Custom | As agreed | As agreed | As agreed | As agreed |
Included in the Trial
A 15-day Trial runs performance tests with the Scale limits: 2,000 virtual users per generator, 12-hour runs and load agents.
Citizen Developer (Free)
Shows a preview of the performance screens. The add-on cannot be bought on the free edition.
Limits are per generator
A run split across load agents can send more in total, because each generator carries its own share.
If the add-on ends
Scenarios, runs, reports and targets stay readable. New runs, scheduled runs and scenario changes are refused until it is renewed.
Built-in load testing vs a separate script-based tool
| Shift-Left API | Separate tool (k6, JMeter, Gatling) | |
|---|---|---|
| Where tests come from | Your existing REST, SOAP, GraphQL and JSON-RPC tests and workflows | Separate scripts (JavaScript, Scala, XML test plans) maintained alongside functional tests |
| Auth, headers, bodies | Built by the same code as a functional run, from your auth profiles | Re-implemented in the script |
| Result | Verdict in words first, then figures | Metrics and thresholds you interpret |
| Requirements | Targets linked to requirements; Under load column in the traceability matrix | Not connected to requirements |
| Deployment | Self-hosted or cloud, with load agents that connect out | Varies: open-source CLI, self-managed, or vendor cloud |
When a dedicated load tool is still the better fit
- Browser or page-load testing. Shift-Left API measures the API, not the page.
- Server CPU and memory. Link your monitoring dashboards to an environment; the report links to them for the same window.
- Protocols outside the list above, such as JDBC, JMS or gRPC, and WebSocket-RPC or MCP endpoints under load.
API load testing: frequently asked questions
Can I load test APIs using my existing functional tests?
Yes. Performance tests in Shift-Left API are built from the tests you already have. Start from a test with Run as load test, from a pack with Create load scenario from this pack, or from the performance test designer. Every request is built by the same code a functional run uses, so the same authentication, headers and body go out under load, and values saved by one step feed the next.Which protocols can be load-tested?
REST, SOAP, GraphQL and JSON-RPC tests. For a SOAP operation, the envelope is built once and then sent under load with each user’s values filled in. WebSocket-RPC calls and MCP server endpoints cannot be load-tested, because each needs a held session per user.What kinds of performance test are supported?
Smoke, load, stress, spike, soak, breakpoint, concurrency, rate-limit probe and custom. Load, soak and concurrency tests hold a number of virtual users; stress, spike, breakpoint and rate-limit tests hold a request rate, so a slowing API cannot quietly receive less traffic.Which plans include performance testing?
Performance testing is a paid add-on to a Professional, Custom or Enterprise licence; no edition includes it on its own, Enterprise included. The add-on package sets the limits: Starter (100 virtual users per load generator, 15-minute runs, one run at a time, no load agents), Team (500, 60-minute runs, one at a time, 2 load agents), Scale (2,000, 12-hour runs, two at a time, any number of load agents) or Custom. The 15-day Trial includes it with the Scale limits. The free Citizen Developer edition shows a preview of the screens and cannot buy the add-on. Contact sales for add-on pricing.What happens when the add-on ends?
Your scenarios, runs, reports and targets stay readable. New runs, scheduled runs and changes to scenarios are refused with a message that says when the add-on ended. Administrators see a warning on the Performance home from 14 days before the end date.How does the report decide Pass, Fail or Inconclusive?
The run is judged on its steady stage against the targets you set, such as p95 under 800 ms and errors under 1%. Percentiles come from merged histograms, never averages. Anything that limits what the run proves comes first: for example, if the load generator ran out of CPU, the verdict becomes Inconclusive rather than blaming your API.Can I run load tests from CI/CD?
Yes. Start a scenario with an API key by calling POST /api/performance/scenarios/{scenarioId}/run, poll GET /api/performance/runs/{runId}, and fetch /api/performance/runs/{runId}/junit.xml for your CI test report. Each target becomes a test case, and the report carries why a run failed. Scenarios can also run on a schedule and notify by email, Slack, Teams or a webhook.Does it replace k6 or JMeter?
For API load testing built from your functional suite, often yes. It is not a browser or page-load test, it does not measure your servers’ CPU or memory (link your monitoring dashboards to an environment instead), and it does not cover protocols such as JDBC, JMS or gRPC. Teams with those needs keep a dedicated tool for them.How much load can one machine send?
One generator on an ordinary laptop can usually send a few thousand requests per second, within your add-on package’s virtual-user limit. The report says when the generator itself was the limit. For more, the Team and Scale packages (and the Trial) can split a run across load agents, with a synchronized start and exactly merged measurements.
Documentation
Load test your APIs with the tests you already have
The 15-day trial includes performance testing with the Scale package limits: up to 2,000 virtual users per generator and load agents. No credit card required.