
11 Best API Load Testing Tools in 2026 (Free & Open Source)
Quick answer
The best free/open-source API load testing tools are JMeter (mature, multi-protocol, GUI-based), k6 (JavaScript, CLI-first, lightweight), Gatling (Scala DSL, high throughput per machine), and Locust (Python-scripted, distributed by default). For teams wanting managed distributed load and enterprise reporting without running their own infrastructure, BlazeMeter, LoadRunner, and NeoLoad are the established commercial options, and k6 Cloud / Gatling Enterprise add managed distributed runs on top of their open-source cores.
Reviewed by Smeet Gohel
API load testing tools measure how an API performs under concurrent traffic — response time, throughput, and error rate at realistic and peak load — a different question than whether a single response is functionally correct. This list covers the 11 tools that actually matter in 2026: five open-source scripted tools that cover most teams' needs completely, three lightweight CLI benchmarking tools for quick checks, and three commercial platforms for teams needing managed distributed load or enterprise reporting.
In this guide
- API load testing comparison table
- The three groups these fall into
- JMeter
- k6
- Gatling
- Locust
- Artillery
- wrk
- hey
- Vegeta
- BlazeMeter
- LoadRunner
- NeoLoad
- The metrics that decide pass or fail
- Putting a load gate in CI
- How to Choose
- Common load testing mistakes
- Frequently asked questions about API load testing
API load testing comparison table
| # | Tool | Type | Scripting | Protocols | CI/CD fit | Best for |
|---|---|---|---|---|---|---|
| 1 | JMeter | Free / OSS | GUI + XML (.jmx) | HTTP, JDBC, JMS, FTP, more via plugins | jmeter -n -t | Multi-protocol needs, mature plugin ecosystem |
| 2 | k6 | Free / OSS core, paid cloud | JavaScript | HTTP, WebSocket, gRPC | k6 run, official GitHub Action | JavaScript-native teams, lightweight CI |
| 3 | Gatling | Free / OSS core, paid enterprise | Scala DSL (also Java/Kotlin DSL) | HTTP, WebSocket, JMS, MQTT | mvn gatling:test or CLI | Highest throughput per machine, detailed reports |
| 4 | Locust | Free / OSS | Python | HTTP (extensible) | locust --headless | Python teams, distributed load out of the box |
| 5 | Artillery | Free / OSS core, paid cloud | YAML + JavaScript hooks | HTTP, WebSocket, Socket.IO | artillery run | Quick setup, lightweight API + WebSocket tests |
| 6 | wrk | Free / OSS | CLI flags (Lua for advanced) | HTTP | Single CLI command | Maximum requests/sec from one machine |
| 7 | hey | Free / OSS | CLI flags only | HTTP | Single CLI command | The simplest possible throughput check |
| 8 | Vegeta | Free / OSS | CLI flags, or Go library | HTTP | Single CLI command | Constant-rate testing and latency histograms |
| 9 | BlazeMeter | Commercial | JMeter-compatible + own scripting | HTTP and JMeter's full protocol range | Native CI integrations | Managed distributed JMeter at scale |
| 10 | LoadRunner | Commercial | Proprietary scripting (C-like) | Very wide (HTTP, RDP, Citrix, and more) | CI plugins available | Large enterprises needing broad legacy protocol coverage |
| 11 | NeoLoad | Commercial | Low-code + scripting | HTTP, web, mobile | CI plugins available | Enterprise teams wanting low-code test design and APM integration |
Streaming endpoints need different assertions again — the WebSocket testing tools roundup covers ordering, reconnection and protocol conformance.
If you are choosing the runner rather than writing the script, k6 vs JMeter vs Gatling compares all three on scripting, efficiency and CI.
The three groups these fall into
The eleven tools are not eleven alternatives. They divide into three groups that answer different questions, and picking across groups is the most common way a load-testing evaluation goes wrong.
Scenario-based tools (1–5) simulate a user journey: log in, browse, add to cart, check out, with think time and correlated data between steps. This is what you need when the question is "does the system hold up under realistic traffic".
Single-endpoint benchmarkers (6–8) fire one request as fast as possible and report the distribution. They answer "how fast is this endpoint right now" in about ten seconds of setup, and they cannot express a journey at all.
Managed enterprise platforms (9–11) run the first group's workloads at a scale and with reporting that your own infrastructure would struggle to provide, plus protocol coverage that matters mainly to organisations with legacy systems.
1. JMeter
Apache JMeter is the longest-established name in this list — free, Java-based, GUI-authored, and built to test far more than HTTP (JDBC, JMS, FTP among others via its extensive plugin ecosystem). Its GUI is best for authoring and debugging; real load generation should always run headless (jmeter -n -t plan.jmx -l results.jtl). See our full JMeter API load testing tutorial for a complete Test Plan walkthrough.
The thing to know before committing: .jmx files are XML that a GUI wrote, which makes code review and merge conflicts genuinely painful on a team. JMeter's protocol breadth is unmatched in open source, and that breadth is the reason to choose it.
2. k6
k6 (from Grafana Labs) skips the GUI entirely — a load test is a JavaScript file run with k6 run, checked into version control like any other code. Its thresholds mechanism gates CI directly: a breached threshold produces a non-zero exit code with no extra parsing logic needed. See our k6 load testing tutorial for virtual users, staged ramp-up, and CI integration.
// k6 thresholds are the gate — a breach exits non-zero, no parsing required
export const options = {
  stages: [
    { duration: '2m', target: 100 },
    { duration: '5m', target: 100 },
    { duration: '2m', target: 0 },
  ],
  thresholds: {
    http_req_duration: ['p(95)<400', 'p(99)<1000'],
    http_req_failed: ['rate<0.01'],
  },
};
Ready to shift left with your API testing?
Try our no-code API test automation platform free. Generate tests from OpenAPI, run in CI/CD, and scale quality.
3. Gatling
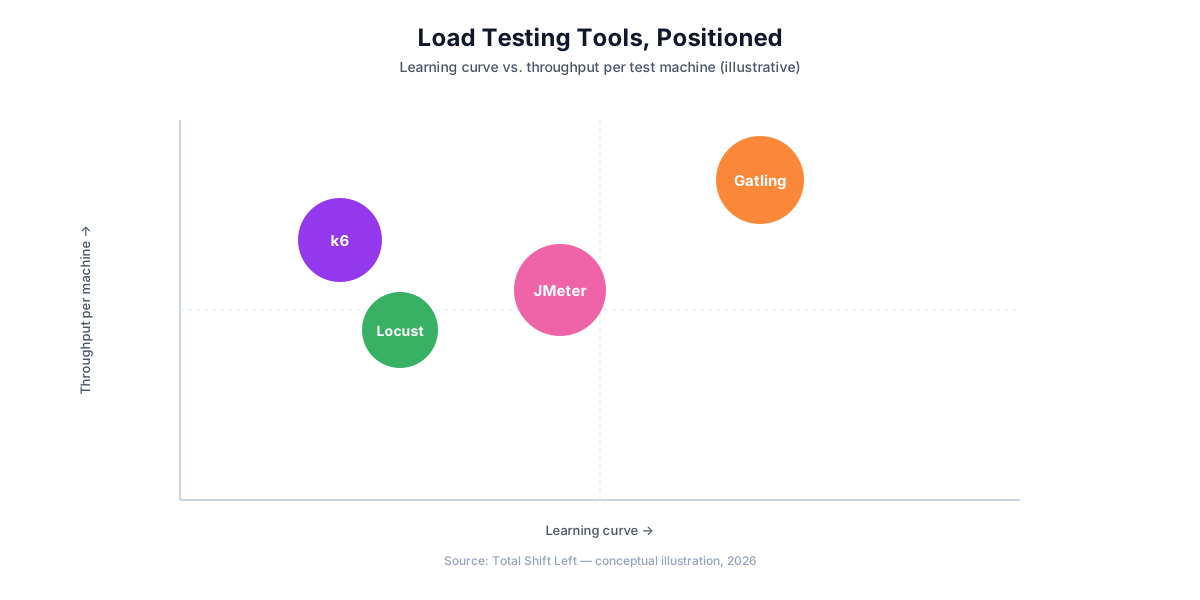
Gatling's async, non-blocking engine gives it a real edge in requests-per-second generated per test machine compared to thread-per-user tools — useful when you need heavy load without provisioning a large load-generation cluster. Tests are written in a Scala DSL (a Java and Kotlin DSL are also available for teams that prefer them), and its built-in HTML reports are widely regarded as the most detailed among the open-source options out of the box. The tradeoff is a steeper learning curve than k6's plain JavaScript for teams without Scala experience.
4. Locust
Locust scripts load tests in plain Python — a locust_user.py file defining tasks a simulated user performs — and distributes load across multiple worker processes or machines natively, with a real-time web UI for monitoring an in-progress run. It's the natural choice for teams already working in Python who want distributed load generation without a separate distributed-execution setup.
Because scenarios are ordinary Python, anything importable is usable inside a test — the same factories and fixtures your functional suite already has, rather than a parallel set written in a DSL.
5. Artillery
Artillery defines test scenarios primarily in YAML, with JavaScript hooks for custom logic, and supports WebSocket and Socket.IO testing alongside plain HTTP — a niche few of the other tools cover as directly. It's lightweight to set up for a quick load check and has a commercial cloud offering (Artillery Cloud) for managed distributed runs.
6. wrk
A single C binary that saturates an endpoint using multiple threads and an event loop, and typically generates more load from one machine than anything else in this list. Advanced scenarios are possible through Lua scripting, but that is not what it is for.
# 30 seconds, 12 threads, 400 open connections
wrk -t12 -c400 -d30s https://api.example.com/users/1
7. hey
The simplest of the three: a Go binary that sends N requests with C concurrency and prints a latency breakdown. There is almost nothing to learn, which is the point — it is the fastest way to answer "is this endpoint slow".
# 1000 requests, 50 concurrent
hey -n 1000 -c 50 https://api.example.com/users/1
8. Vegeta
Vegeta differs from the other two in a way that matters: it holds a constant request rate rather than a constant number of connections. That models real traffic more honestly, because real users do not slow down when your API does, and it is the tool to reach for when you want to know what happens at exactly 500 requests per second.
# hold 50 requests/sec for 30 seconds, then report percentiles
echo "GET https://api.example.com/users/1" | vegeta attack -rate=50 -duration=30s | vegeta report
Reach for tools 6–8 when you need a fast, no-setup throughput number for a single endpoint — not when you need a realistic multi-step user scenario, which is what the scripted tools above are built for.
9. BlazeMeter
BlazeMeter (by Perforce) is a commercial, cloud-based load testing platform built around JMeter-script compatibility — teams with existing .jmx files can run them at cloud scale without JMeter's own distributed-testing setup, plus enterprise reporting and CI integrations layered on top.
10. LoadRunner
LoadRunner (OpenText, formerly Micro Focus) is the longest-established enterprise load testing tool, with protocol support extending well beyond HTTP into RDP, Citrix, and other legacy enterprise protocols most open-source tools don't cover at all. It suits large enterprises with a genuine need for that protocol breadth and existing LoadRunner licensing, more than teams testing modern REST/GraphQL APIs exclusively.
11. NeoLoad
NeoLoad (Tricentis) emphasizes low-code test design — building a load test through a visual interface rather than a scripting language — plus integration with APM tooling to correlate load-test results directly against backend performance metrics. It's aimed at enterprise teams wanting that integration and a gentler authoring curve than a scripting-DSL tool.
The metrics that decide pass or fail
The tool matters less than what you assert on. Four numbers carry almost all the signal.
| Metric | Why it matters | A reasonable starting gate |
|---|---|---|
| p95 latency | What a normal bad request feels like | Under your SLO, commonly 300–500 ms |
| p99 latency | Where timeouts and retries begin | Under the client timeout |
| Error rate | Whether the system is shedding load | Below 1% |
| Throughput at target | Whether it holds the rate at all | Meets expected peak plus headroom |
Two rules save most of the arguments. Never gate on the mean — an average hides the tail entirely, and the tail is the user experience people complain about. And always report the rate you actually achieved, not the rate you requested: a run that asked for 500 requests per second and delivered 240 has already found the answer, whatever the latency numbers say.
Putting a load gate in CI
Load tests belong on a schedule and before a release, not on every pull request — they take minutes and need a stable environment. The gate itself is ordinary:
Free Guided worksheet
Build Your Testing Strategy in 30 Minutes
A structured worksheet that walks you through defining your testing strategy in 30 minutes. Cover architecture, tools, layers, and team responsibilities.
Download Free# .github/workflows/load.yml
name: Load test
on:
schedule: [{ cron: '0 3 * * *' }]
workflow_dispatch:
jobs:
k6:
runs-on: ubuntu-latest
steps:
- uses: actions/checkout@v4
- name: Run k6 against staging
run: docker run --rm -i grafana/k6 run - < load/checkout.js
env:
BASE_URL: ${{ secrets.STAGING_URL }}
# thresholds already fail the step; nothing else to parse
Run it against an environment whose shape you know. A load test against a staging box a quarter the size of production produces a number that is precise and meaningless.
How to Choose
- Multi-protocol needs (not just HTTP) → JMeter or LoadRunner.
- JavaScript-native team, CI-first → k6.
- Maximum throughput per test machine → Gatling.
- Python-native team, want distributed load with no extra setup → Locust.
- Quick WebSocket or Socket.IO coverage → Artillery.
- A single fast throughput number, no scenario needed → wrk or hey.
- A constant request rate and latency histogram → Vegeta.
- Existing JMeter scripts, need managed cloud scale → BlazeMeter.
- Enterprise, need APM integration and low-code authoring → NeoLoad.
Common load testing mistakes
Testing a cold system. The first minute of any run measures JIT compilation, empty caches and cold connection pools. Warm up, then measure.
Load-testing through a cache you would not have in production. A CDN or reverse proxy in front of staging turns a load test into a cache benchmark. Confirm what is actually being exercised before trusting the number.
One giant number as the goal. "Can we do 10,000 requests per second" is rarely the real question. "Does checkout stay under 400 ms at our Black Friday peak" is answerable, gateable, and tied to something a business cares about.
Ignoring the load generator's own limits. A single machine runs out of file descriptors, ephemeral ports and CPU long before a well-built API does. If the generator is saturated, you are measuring the generator.
Treating load results as correctness results. Whichever tool you choose, pair it with a functional suite (pytest, REST Assured, or a generated suite) — load testing tools measure performance, not business-logic correctness, and neither replaces the other. See the API testing checklist for the complete set of items each should cover.
Frequently asked questions about API load testing
What is the best free API load testing tool? JMeter, k6, Gatling, and Locust are all fully free and open-source. JMeter has the deepest plugin ecosystem; k6 is the lightest and most CI-friendly; Gatling has the highest throughput per machine; Locust is the natural fit for Python teams.
JMeter vs k6 vs Gatling — which should I use? JMeter for multi-protocol needs (HTTP, JDBC, JMS) and the widest plugin ecosystem. k6 for JavaScript-native teams wanting a lightweight, CLI-first tool with strong CI/CD integration. Gatling for teams wanting the highest requests-per-second per test machine and detailed built-in HTML reports, at the cost of learning its Scala DSL.
Do I need a commercial load testing tool, or is open source enough? Open-source tools fully cover scripting, execution, and CI/CD. Commercial tools add managed distributed load at scale and enterprise reporting — worth it once you need load beyond your own infrastructure or compliance-grade reporting.
What is the difference between a load testing tool and an API testing tool? A load testing tool measures how an API performs under concurrent traffic — response time, throughput, error rate. An API testing tool (pytest, REST Assured, Postman) verifies an individual response is functionally correct. They answer different questions and are not substitutes for each other.
Can I run load tests in CI/CD with these tools? Yes — JMeter, k6, Gatling, and Locust all support a headless CLI mode built specifically for CI. JMeter uses -n -t, k6 uses k6 run, and both have official GitHub Actions. Most teams gate load tests to pull requests or a schedule rather than every commit, since they take meaningfully longer than a functional suite.
Which load testing tool has the best reporting? Gatling's built-in HTML reports are widely regarded as the most detailed out of the box among the open-source tools. JMeter's -e -o flag generates a comparable HTML dashboard. Commercial tools like BlazeMeter and NeoLoad add enterprise-grade dashboards and historical trend tracking across many runs, which the open-source tools don't provide natively.
Sources and further reading
- Grafana k6 documentation — scripted load testing with thresholds you can gate on.
- Apache JMeter User Manual — the reference manual for JMeter test plans.
- Google SRE Workbook — Implementing SLOs — how to define SLOs and error budgets.
Key takeaways
- JMeter, k6, Gatling, and Locust fully cover most teams' load testing needs for free — commercial tools add managed scale and enterprise reporting, not fundamental capability.
- wrk/hey/Vegeta are for a quick throughput number, not a realistic multi-step scenario — use the scripted tools for that.
- Gatling generates the most load per test machine; k6 is the lightest weight and most CI-native for JavaScript teams.
- A load testing tool and a functional testing tool answer different questions — pair one of each, don't substitute one for the other.
- All the major open-source tools run headless in CI, typically gated to PRs or a schedule given how much longer load tests run than functional suites.
Pair Load Testing with Automatically Generated Functional Coverage
These tools measure whether your API holds up under load — they were never meant to enumerate every functional case across every endpoint. Total Shift Left generates the functional suite directly from your OpenAPI spec, so your team's effort goes into the load and performance testing these tools are built for.
Start your free trial to see the generated functional suite, or see plans and pricing if you're already evaluating.
Ready to shift left with your API testing?
Try our no-code API test automation platform free.