
API Performance & Load Testing From Your Existing Tests
Turn the API tests you already have into load, stress, spike and soak tests, and get a verdict in words.
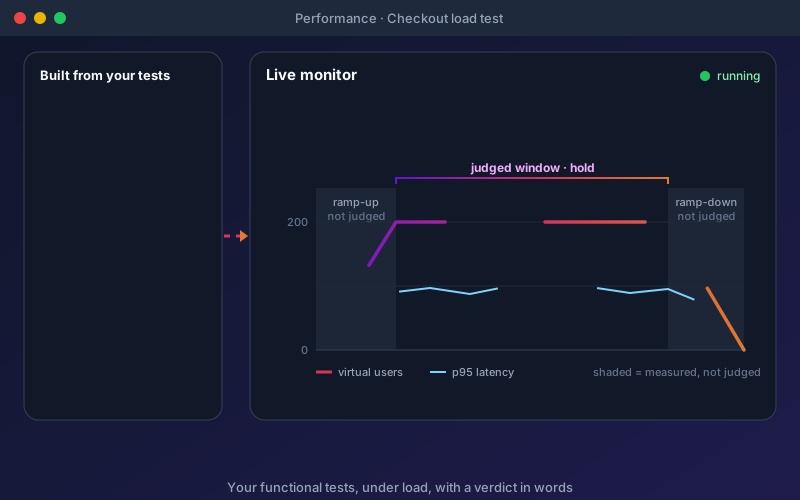
What It Does
Most teams keep their load tests in a second tool, written in a second language, that drifts away from the functional suite. Shift-Left API removes the second tool. Start from a test with "Run as load test", from a pack with "Create load scenario from this pack", or from the designer, which walks through five steps: kind and name, workloads and steps, load profile, targets, and a dry run that builds the exact plan and sends nothing. Values saved by one step, such as an order id, feed the next under load exactly as in a functional run, and a bound data set gives each virtual user different values. Load, soak and concurrency tests hold a number of virtual users; stress, spike, breakpoint and rate-limit tests hold a request rate, so a slowing API cannot quietly receive less traffic. Before any load, one request per step is sent as a precheck, and a run stops itself if more than half its requests fail for ten seconds. If the machine sending the load ran out of CPU, the report says so and the verdict becomes Inconclusive instead of blaming your API.
Overview
Performance testing is built from the functional tests you already trust. Pick tests or a workflow, choose how much traffic, set your targets and run: every request is built by the same code a functional run uses, so the same authentication, headers and bodies go out under load. Nine kinds of test answer nine different questions, from a one-minute smoke run to a twelve-hour soak. The report leads with a verdict in words (Pass, Fail or Inconclusive, with the reason), then shows honest figures: percentiles merged from histograms, never averaged, and judged only on the steady stage. When a run fails, every cause is listed with how many requests it hit, when it began and how much load there was at that moment.
Key Capabilities
How It Works
- 1
Choose a kind of test (or start from a test or pack) and pick the tests or workflow to run
- 2
Set the load profile in users or requests per second, and your targets such as p95 under 800 ms
- 3
Do a dry run to see the exact requests, checks and data-changing steps; nothing is sent
- 4
Run and watch throughput, response times, errors and targets live; stop at any time
- 5
Read the verdict, every cause of failure, percentiles and phase timings, then compare with the baseline
Available on
Performance & Load Testing add-on (paid add-on)
Added to a Professional, Custom or Enterprise licence. Included in the 15-day free trial — no credit card required.
Documentation
Step-by-step guides for setting up and using Performance Testing.
- Performance Testing: Load, Stress, Spike, Soak and MoreA functional test tells you whether your API gives the right answer. A performance test tells you whether it still gives that answer, fast enough, when many people use it at once.
- Create and Run a Performance TestDesign a performance test step by step (kind, workloads, load profile, targets), check it with a dry run, run it and watch it live, then find out why a run failed.
- Read a Performance Report: Percentiles, Verdicts and SLOsWhen a performance run finishes, Shift-Left Studio builds one report for it. The same report is what you see on screen, what you export as HTML, JSON or JUnit, what a share link shows, and what the project assistant reads.
Go deeper
Guides and playbooks that show this capability in practice.
Related Features
Performance Targets
Say what "fast enough" means once, and see it judged on every run and in your requirements matrix.
Learn moreLoad Agents
Add machines to send more load, or load from several places, and still read one merged report.
Learn moreTest Packs
Group and batch-execute tests for focused regression runs.
Learn moreTry Performance Testing Today
Start your 15-day free trial — no credit card required.