
JMeter API Testing Tutorial: Load Testing Your Endpoints (2026)
Quick answer
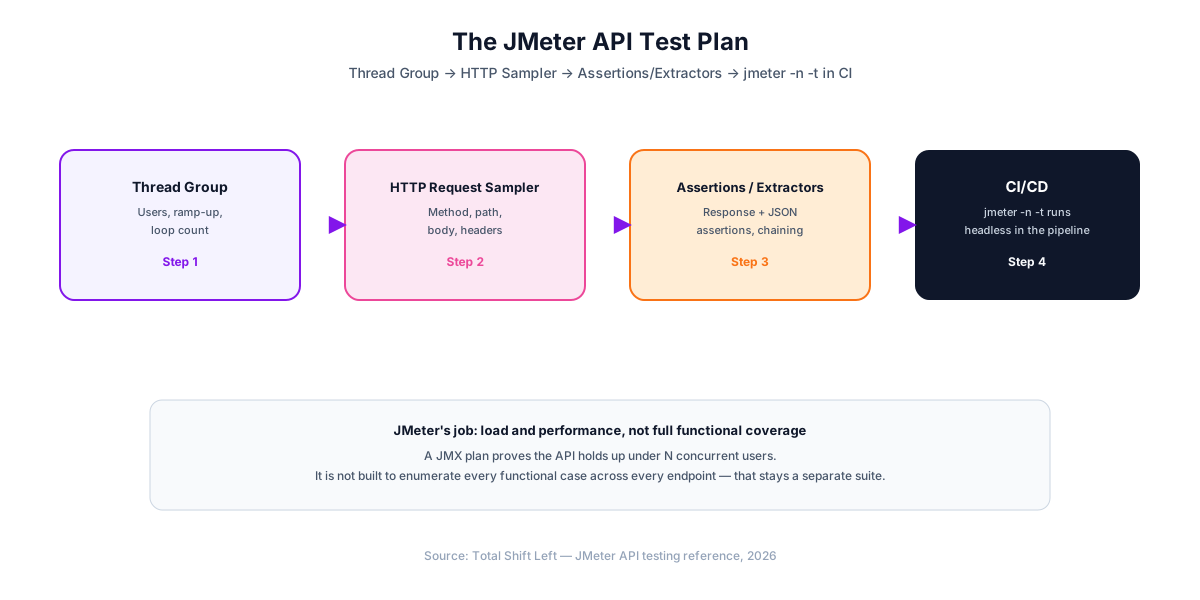
Apache JMeter tests API load and performance by building a Test Plan — a Thread Group defining concurrent users, an HTTP Request Sampler sending the call, and Assertions checking the response — then running it either in the desktop GUI for authoring or headless via jmeter -n -t for CI/CD. It answers a different question than a functional suite like pytest or Postman: not "is the response correct once," but "does the API hold up correctly under N concurrent users."
Reviewed by Smeet Gohel
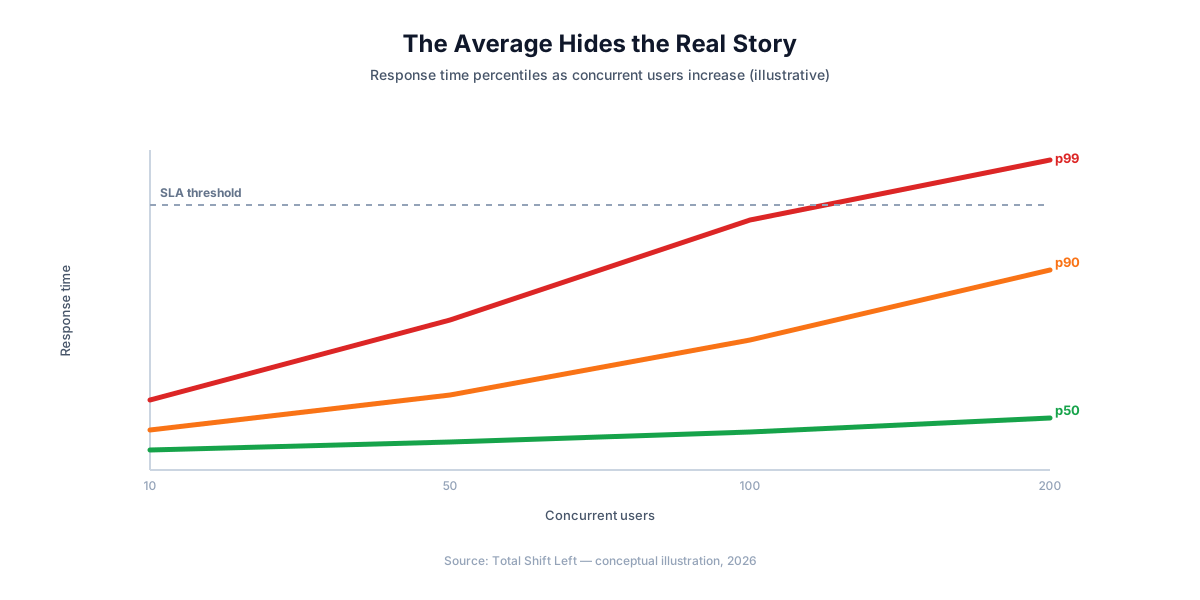
JMeter API testing means using Apache JMeter — a Java-based load testing tool — to send an API request from many simulated concurrent users at once and measure how the API behaves under that load: response time, throughput, and error rate. It answers a fundamentally different question than a functional test: not "is this response correct," but "is it still correct, and still fast, at 200 concurrent users."
This guide builds a real JMeter Test Plan: Thread Group configuration, an HTTP Request Sampler, JSON Assertions, CSV-driven parametrization, and running the whole plan headless in a GitHub Actions pipeline — the way JMeter is actually meant to be run outside of local authoring.
In this guide
- What JMeter Is Actually For
- What you need before you start
- Anatomy of a JMeter Test Plan
- Building Your First Test Plan
- Adding Assertions
- Parametrizing Requests with a CSV Data Set
- Chaining Requests with a JSON Extractor
- Running Headless for Real Load
- Running JMeter in CI/CD with GitHub Actions
- Reading the Results
- Common Pitfalls in JMeter Load Testing
- JMeter vs k6 vs Functional API Testing
- Correlation and think time: the two things that make load realistic
- Frequently asked questions about JMeter API testing
What JMeter Is Actually For
Every other tutorial in this series — pytest, REST Assured, Playwright — answers "is this one response correct?" JMeter answers "is the API still correct and fast when hundreds of requests hit it at once?" Those are complementary, not competing, questions: a functionally perfect endpoint can still fall over under load, and a fast endpoint can still return the wrong data. A mature test strategy needs both, run by different tools.
JMeter has been the default answer to the load-testing half of that question for over two decades, because it is free, protocol-agnostic (HTTP, JDBC, JMS, FTP, and more via plugins), and — despite its GUI-first reputation — designed from the start to run headless for real test execution.
If you are choosing between runners rather than writing one, the best API load testing tools compares k6, JMeter, Gatling, Locust and the hosted options on protocol support, scripting language and CI integration.
If your tooling behaves differently across spec versions, OpenAPI 3.0 vs 3.1 explains why.
If you are choosing the runner rather than writing the script, k6 vs JMeter vs Gatling compares all three on scripting, efficiency and CI.
What you need before you start
- Java 8+ (JMeter 5.6+ recommends Java 11 or newer)
- Apache JMeter, downloaded from jmeter.apache.org — no install required, it runs from the extracted archive
# macOS/Linux
tar -xzf apache-jmeter-5.6.3.tgz
cd apache-jmeter-5.6.3/bin
./jmeter.sh          # opens the GUI, for authoring only
Check the JMeter downloads page for the current release before downloading — this guide's structure applies to any 5.x version.
Anatomy of a JMeter Test Plan
A .jmx file (JMeter's XML test plan format) is a tree of elements. The ones that matter for API load testing:
- Test Plan — the root container
- Thread Group — defines the load: number of threads (concurrent users), ramp-up period, and loop count
- HTTP Request Defaults (Config Element) — shared server name/port so individual samplers can use relative paths
- HTTP Request (Sampler) — the actual call: method, path, body, headers
- Assertions — pass/fail criteria checked against each response
- Listeners — collect and display results (View Results Tree for debugging, Summary Report for aggregate metrics)
You build this tree in the GUI, but you almost never hand-edit the underlying XML — the GUI generates it, and CI runs the saved .jmx file directly.
Building Your First Test Plan
- Right-click Test Plan → Add → Threads (Users) → Thread Group. Set Number of Threads to
10, Ramp-Up Period to10(seconds), Loop Count to1— this ramps up to 10 concurrent virtual users over 10 seconds, each running the plan once. - Right-click the Thread Group → Add → Config Element → HTTP Request Defaults. Set Server Name or IP to
jsonplaceholder.typicode.comand Protocol tohttps— every sampler below now defaults to this server. - Right-click the Thread Group → Add → Sampler → HTTP Request. Set Method to
GETand Path to/users/1. - Right-click the Thread Group → Add → Listener → View Results Tree (for debugging) and Summary Report (for aggregate metrics).
- Save the plan as
api-load-test.jmx, then click the green Start arrow to run it inside the GUI once, to confirm it works before moving to headless execution.
Ready to shift left with your API testing?
Try our no-code API test automation platform free. Generate tests from OpenAPI, run in CI/CD, and scale quality.
Adding Assertions
An assertion turns "the API responded" into "the API responded correctly." Right-click the HTTP Request sampler → Add → Assertions → Response Assertion, set the field to test to Response Code, pattern to match: 200.
For JSON body content, use Add → Assertions → JSON Assertion instead: set the JSON Path expression (e.g. $.email) and, optionally, an expected value. JMeter's JSON Assertion checks that the path exists and, if you provide one, that its value matches — it is deliberately simple, not a full JSON Schema validator.
For anything more complex than a path check, add a JSR223 Assertion and write a short Groovy script against the response body — this is the escape hatch when the built-in assertions aren't expressive enough.
Parametrizing Requests with a CSV Data Set
Testing every simulated user against the same hardcoded ID does not reflect real traffic. Add Test Plan → Add → Config Element → CSV Data Set Config, point Filename at a CSV like:
userId
1
2
3
4
5
Set Variable Names to userId, then reference it in the sampler's Path field as /users/${userId}. By default, each thread reads the next row in sequence, so your 10 concurrent users in the example above hit five different user IDs (wrapping around) instead of the same one repeatedly.
Chaining Requests with a JSON Extractor
A realistic load test often needs output from one request as input to the next — creating a resource, then fetching it. Add Add → Post Processors → JSON Extractor to the first sampler, set JSON Path Expressions to $.id, and Names of created variables to newPostId. Reference ${newPostId} in a later sampler's path.
POST /posts   → JSON Extractor captures $.id as ${newPostId}
GET /posts/${newPostId}   → uses the extracted ID
Running Headless for Real Load
The GUI is for authoring, not for generating real load — running many threads inside the GUI consumes resources measuring your own test tool, not the API. Apache's own documentation recommends non-GUI mode for any actual test run:
jmeter -n -t api-load-test.jmx -l results.jtl
-n runs non-GUI, -t specifies the test plan, -l writes results to a .jtl log file. Add -e -o report-output/ to also generate an HTML dashboard report after the run completes:
jmeter -n -t api-load-test.jmx -l results.jtl -e -o report-output/
Running JMeter in CI/CD with GitHub Actions
# .github/workflows/load-test.yml
name: API Load Test

on: [workflow_dispatch, pull_request]

jobs:
  jmeter-load-test:
    runs-on: ubuntu-latest
    steps:
      - uses: actions/checkout@v4
      - uses: actions/setup-java@v4
        with:
          distribution: 'temurin'
          java-version: '17'
      - name: Download JMeter
        run: |
          wget -q https://dlcdn.apache.org/jmeter/binaries/apache-jmeter-5.6.3.tgz
          tar -xzf apache-jmeter-5.6.3.tgz
      - name: Run load test
        run: ./apache-jmeter-5.6.3/bin/jmeter -n -t api-load-test.jmx -l results.jtl -e -o report-output/
      - uses: actions/upload-artifact@v4
        if: always()
        with:
          name: jmeter-report
          path: report-output/
on: [workflow_dispatch, pull_request] runs the load test manually on demand or on every PR — most teams do not want a full load test on every single commit given how much longer it runs than a functional suite, so gating it to PRs (or a scheduled nightly run) is a common middle ground.
Reading the Results
The Summary Report listener (or the generated HTML dashboard) surfaces four numbers that matter most:
- Average / 90th percentile response time — the median hides tail latency; the 90th or 95th percentile is what your slowest real users actually experience.
- Throughput — requests processed per second, your realistic capacity ceiling.
- Error % — non-2xx responses under load; a functionally correct endpoint that starts erroring at 50 concurrent users has a scaling problem, not a correctness problem.
- Std. Dev. — high variance means inconsistent performance even when the average looks fine.
Common Pitfalls in JMeter Load Testing
- Running real load tests from the GUI. It works for authoring and small debugging runs; for actual measurement, always use
-nheadless mode. - Ramping up too fast. A 0-second ramp-up simulates every user hitting the API in the same instant, which is rarely how real traffic arrives — set a ramp-up period that approximates your actual traffic pattern.
- Ignoring percentiles in favor of the average. A 200ms average with a 4-second 95th percentile is a real problem the average alone hides.
- Ignoring JVM heap limits on the machine running JMeter. High thread counts need
-Xmxtuned viaJVM_ARGS, or the load generator itself becomes the bottleneck, not the API. - Treating JMeter as a substitute for functional coverage. Its assertions are built for pass/fail-under-load, not exhaustive positive/negative/boundary testing — keep a dedicated functional suite alongside it.
Free Guided worksheet
Build Your Testing Strategy in 30 Minutes
A structured worksheet that walks you through defining your testing strategy in 30 minutes. Cover architecture, tools, layers, and team responsibilities.
Download FreeJMeter vs k6 vs Functional API Testing
| Approach | What it measures | Language | CI/CD fit | Best for |
|---|---|---|---|---|
| JMeter | Load, throughput, latency under concurrency | GUI + XML (.jmx), headless CLI | jmeter -n -t in CI | Teams needing multi-protocol load testing (HTTP, JDBC, JMS) and a mature plugin ecosystem |
| k6 | Load, throughput, latency under concurrency | JavaScript | k6 run in CI | JavaScript-native teams wanting a lighter, CLI-first load tool |
| pytest / REST Assured / Playwright | Functional correctness of a single response | Python / Java / TypeScript | Native — same runner as unit tests | Verifying each endpoint's business logic, independent of load |
| AI-generated (Total Shift Left) | Functional correctness, generated from spec | None required | Native CI plugins | Keeping functional coverage complete as the API grows, freeing JMeter to focus purely on load |
The practical takeaway: JMeter and a functional suite are not alternatives to choose between — they measure different things and belong in the same pipeline. See monitoring API performance in production for what to watch once the load test itself passes.
Correlation and think time: the two things that make load realistic
Two details separate a JMeter plan that produces a meaningful number from one that produces a large one.
Correlation. Any value the server generates — a session token, a CSRF value, an order id — must be extracted from one response and fed into the next request. A plan that replays a captured token instead usually gets rejected after the first iteration, and the resulting run measures how fast your API returns 401s. The JSON Extractor covers this for JSON APIs; the Regular Expression Extractor covers everything else.
Think time. Real users pause between actions. A plan with no timers sends the next request the instant the previous one returns, which models a machine rather than a person and concentrates load far more tightly than production ever does. Add a Uniform Random Timer so the arrival pattern spreads out, unless you are deliberately testing a burst.
Both omissions produce runs that look impressive and predict nothing. Correlation failures show up as a high error rate the plan reports as throughput; missing think time shows up as a system falling over at a concurrency it handles comfortably in production.
Frequently asked questions about JMeter API testing
What is JMeter used for in API testing? JMeter is primarily a load and performance testing tool. It sends the same API request from many simulated concurrent users at once and measures response time, throughput, and error rate under load — a different question than whether a single response is functionally correct, which is what tools like Postman, pytest, or REST Assured answer.
Do I need the JMeter GUI to run tests in CI/CD? No. Build and debug the Test Plan in the GUI, save it as a .jmx file, then run it headless with jmeter -n -t plan.jmx -l results.jtl in CI. The GUI is a poor choice for actually executing load tests even locally — Apache's own documentation recommends non-GUI mode for any real test run.
How do I parametrize a JMeter test with different data per request? Add a CSV Data Set Config element pointing at a .csv file, then reference its columns as JMeter variables (e.g. ${userId}) in your HTTP Request Sampler. Each thread reads the next row by default, so concurrent users hit the API with different data instead of hammering the same record.
How do I validate a JSON response in JMeter? Add a JSON Assertion (under Assertions) with a JSON Path expression and, optionally, an expected value to match against. For anything beyond a simple path check, a JSR223 Assertion running a Groovy script gives full programmatic control over the response body.
JMeter vs k6 for API load testing — which should I use? JMeter has the deeper GUI, the larger plugin ecosystem, and support for protocols beyond HTTP (JDBC, JMS, FTP). k6 is JavaScript-native, lighter weight, and built CLI-first from the start, which teams already working in Node.js often find faster to adopt. Both run headless in CI/CD; the choice usually comes down to team language preference and existing plugin dependencies.
Can JMeter replace a functional API test suite? No — that is not what it is built for. JMeter's assertions confirm a response is well-formed under load, not that every endpoint's business logic is correct across positive, negative, and boundary cases. Keep a separate functional suite (hand-written or AI-generated from your OpenAPI spec) and use JMeter specifically for load and performance.
Sources and further reading
- Apache JMeter User Manual — the reference manual for JMeter test plans.
- Grafana k6 documentation — scripted load testing with thresholds you can gate on.
- RFC 9110 — HTTP Semantics — the normative definition of methods, status codes and headers.
Key takeaways
- JMeter answers a load question, not a correctness question — pair it with a functional suite, don't replace one with the other.
- Always run real load tests headless (
-n), not from the GUI — the GUI itself consumes resources that skew results. - CSV Data Set Config parametrizes requests so concurrent users hit different data instead of hammering one record.
- Read percentiles, not just the average. A 95th-percentile spike is the latency your real users feel.
jmeter -n -t plan.jmx -l results.jtl -e -o report/is the complete command for CI: run, log, and generate an HTML dashboard.- Gate load tests to PRs or a schedule, not every commit — they run far longer than a functional suite.
Keep Functional Coverage Complete While JMeter Handles Load
JMeter tells you whether your API holds up under load. It was never meant to enumerate every functional case across every endpoint — that is a separate, ongoing maintenance burden as your API grows. Total Shift Left generates the functional suite directly from your OpenAPI spec — positive, negative, and boundary cases for every endpoint — so your team's hand-written effort goes into the load and performance testing JMeter is actually built for.
Start your free trial to see the generated functional suite, or see plans and pricing if you're already evaluating.
Ready to shift left with your API testing?
Try our no-code API test automation platform free.